It’s one thing to understand the major types of risk, and to know which to carry and which to avoid. But none of that information will help you if you don’t know how to measure risk.
It’s one thing to understand the major types of risk, and to know which to carry and which to avoid. But none of that information will help you if you don’t know how to measure risk.
Statistics
One way to measure risk that you may have read about is standard deviation. Standard deviation measures the variability or fluctuations in a specific investment or your portfolio over a specific time period. While I won’t get into the math equation for standard deviation, suffice it to say that the higher the standard deviation the greater the variability of returns and the greater total risk.
The problem with the statistical measurements of risk like standard deviation is that for most individual investors, the number is meaningless and too hard to grasp. Instead, you should focus on more practical ways to measure risk.
“How much am I willing to lose?”
What you really care about are usually two simple things: “How much did I lose and what was my percentage loss?”
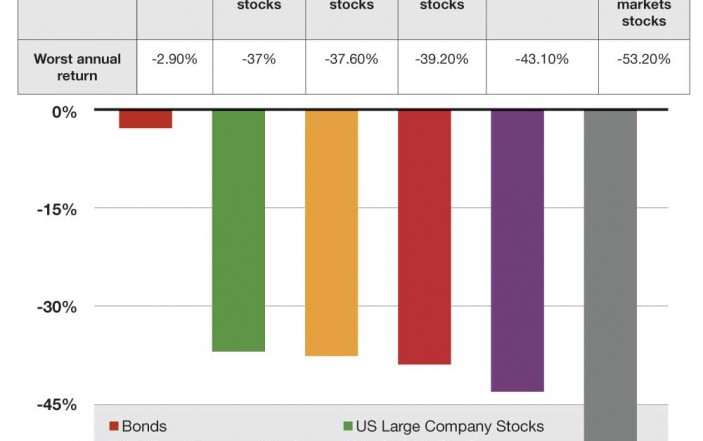
So let’s take a look at a variety of investments (called asset classes) to gauge what percent and dollar losses you had to suffer through to get the returns you want (see table).
The graph shows the worst one-year calendar loss for these investments since 1988, which is the earliest I have data for. When we talk about risk, it appears to be a theoretical concept, but as you can, see the risk is real. Starting with a $100,000 investment in each of the stock asset classes and after experiencing the worst loss in each of them, you would have been left with only $47,000 to $63,000. While 2008 skews the results into more negative territory, even by excluding 2008 the worst annual loss still amounts to almost 30% for most of these asset classes.
Will my returns be enough to reach my goals?
The second practical way you should look at measuring risk is to look at the returns of your portfolio in relationship to the amount you think you need to reach each of your financial goals. Those goals could be retirement, building a legacy for your children, buying a vacation home, and so on. I’ll get to the different factors that you need to think about to come up with that number, but for now simply realize that while you might not want to take much risk, you might HAVE to take more risk to get you where you want to go.
I took different combinations of two investments—US stocks and very short term US bonds—to see the average return of each combination going back to 1926.
As expected, adding more and more bonds (which are less risky) to a portfolio reduced return but also reduced risk. Take a look at the chart here:
So while big losses might not appeal to you, if you’ve got lofty goals you might need to tilt more towards riskier portfolios heavy with stocks. Big goals + conservative portfolio = lower returns and higher risk of not meeting your goals. Determine what percent return you need to reach your goals and then look at the accompanying losses associated with getting those long term returns.
click on image to enlarge
Can you beat inflation?
One of the hidden costs and risks in investing is inflation. But unlike your electricity bill, no one sends you an invoice every month or year for the amount of your purchasing power you lost to inflation. To see just how badly inflation can eat your portfolio over time, take a look at this graph which charts two investments (US stocks and US bonds) before adjusting for inflation and after adjusting for inflation:
Over that time frame you “paid” inflation almost 60% of your investment ($500,000 for bonds and $2 million for stocks). And you thought you were paying a lot of income taxes! The inflation tax can be just as high or higher.
Again, this gets back to the idea of inflation risk. This is a real risk and you have to decide on a portfolio that has a high chance of beating inflation. One thing you should consider is whether you think your pay is going to keep up with inflation. In my 10 years of practicing EM my pay definitely has not. I’ve never gotten a pay raise—only more and more pay cuts. So if this describes you or if your pay is steady, think about increasing the percent of your portfolio to riskier asset classes that have a higher chance of beating inflation.
Conclusion
As you can see there are many different ways to measure risk. While you or your advisor may be tempted to look just at mathematical concepts, the measures of risk that pertain to your risk tolerance and financial goals matter more.
Setu Mazumdar, MD practices EM and he is the president of Lotus Wealth Solutions in Atlanta, GA www.lotuswealthsolutions.com


